
I don’t run much on my Mac system other than Google Chrome, but I leave a lot of tabs open. And yet, my computer runs slowly. Can I figure out which tab is consuming all my CPU?
There are a number of reasons that Google Chrome can be running slowly on your Mac system, actually, and not all of them are related to individual tabs. One thing that could be going on is that there’s an app or service running in background that’s consuming a lot of CPU resources or memory resources, for that matter. You could also be running out of disk space: Run out completely and your computer will definitely slow down.
Most Web pages are fairly low processor usage too, but not all. Sometimes there are complex animations that just keep running whether you’re viewing the tab or not, and other times there can be streaming video on the page that can be a bear. Heck, Google Mail – Gmail – is known to be a memory hog and it’s smart to quit and restart that tab every day or so rather than just leave it running for weeks on end.
To start, let’s just check your disk space. That’s easily done at the bottom of every single Finder window, but jump to the very top of the file system and Get Info on your main drive (command-I) to check the stats:

You can see that this is a 500GB drive (alright, 499.96 GB) and there are 114.03GB available. Plenty of space…
Assuming that’s not the issue on your computer, you can check both memory utilization and CPU usage by using the super helpful Mac Activity Monitor program. Easiest way to start it is through Spotlight: Press Command-Shift to open the window, then type in “activity monitor”. It launches then you need to give it a few seconds to collect process information, then it’ll show something like this:
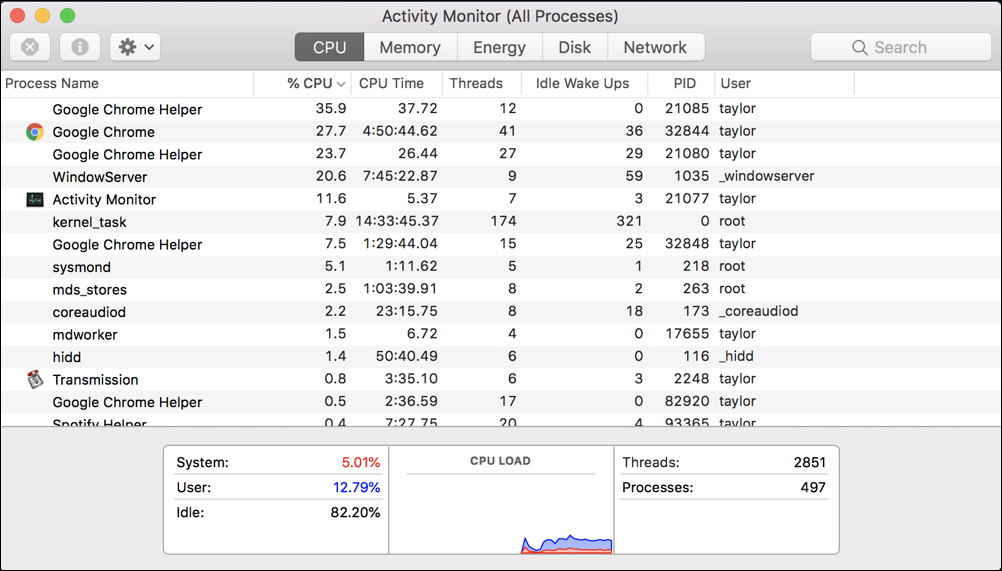
Check for the tiny “V” symbol adjacent to “% CPU” in the first column and click that column title if you don’t see it. You can actually sort by whatever column you’d like, and a second click reverses the order of the sort. Here you can see that Google Chrome Helper is eating most of the CPU on the computer and three of the top four programs are related to Google Chrome.
Note: Wondering how they can add up to more than 100%? Because your processor has multiple CPUs or cores. If you have a quad-core, for example, you can have 4 * 100% utilization, though it tends not to be perfectly balanced.
You can also glance at the graphic near the bottom: blue is user, red is system and it’s also showing that the CPU is 82.2% idle. Definitely not pushing the processor too much with that much idle time. But sometimes apps ebb and flow in their usage too, so you can also just leave this window open and glance at it when your processor seems particularly slow.
Then again, perhaps it’s memory. Click on the Memory column title to sort by processor memory usage:
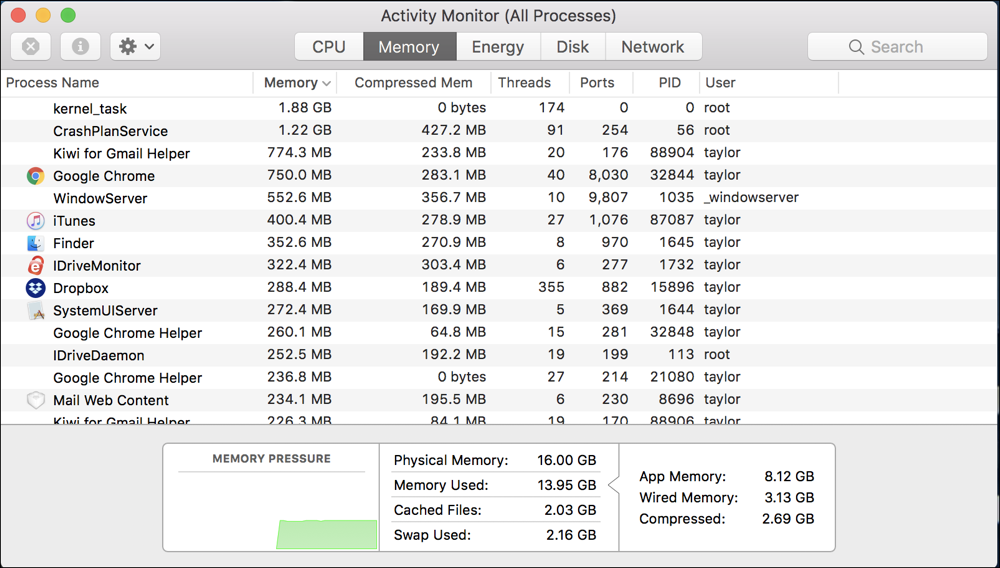
Let’s start at the bottom this time. Notice the graph shows that we have about 60% free memory, and that the numbers show the system has 16GB and 13.95GB is used. That breaks down into 8.12GB of app memory: about half the available RAM overall. Don’t worry if Memory Used seems pretty close to total Physical Memory, by the way; the operating system is designed to swap out processes so can offer apps far more than just the physical memory installed in the computer.
In other words, if your memory pressure is pretty low – like mine – then you’re likely ok. If not, you can look at the Activity Monitor to identify which apps are eating up the most memory. In my case CrashPlanService is a pretty greedy third party app, so I might turn it down as it’s redundant with my iDrive cloud backup service.
But let’s say that it is Google Chrome that’s being so darn greedy. How do you figure out which of your many tabs is the culprit? Well, there’s some data, but it’s not quite as easy to interpret.
Switching to Google Chrome, launch Task Manager from the Chrome “Window” menu:
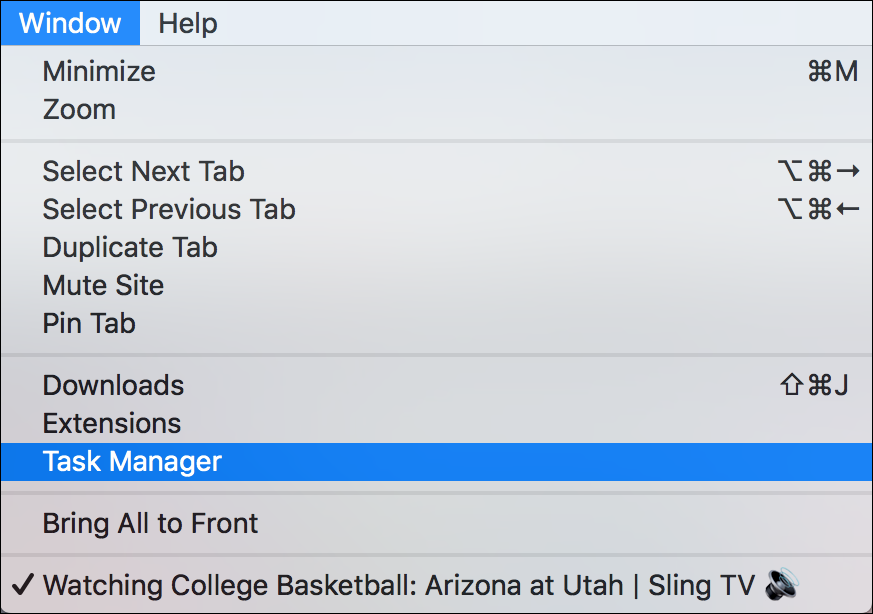
Notice from the very last entry on that menu that I’m watching a college basketball game in one of my tabs while writing this tutorial article. You’d think that would account for a huge CPU and memory demand, right? Let’s find out!
The Chrome Task Manager opens and by default it also sorts by CPU usage:
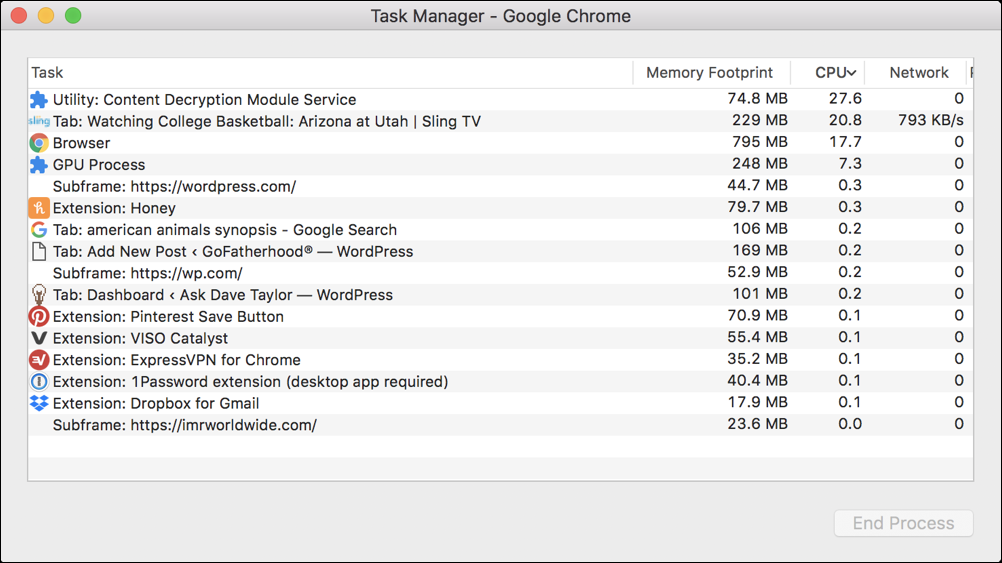
The Content Decryption Module Service is using up a lot of CPU resources, but the second entry is what we’re interested in: Tab: Watching College Basketball: Arizona at Utah | Sling TV. A close examination shows that it’s the to Tab by CPU (20% of all processor usage) and it’s requiring 229MB of memory. Surprisingly, not too horrible for a live video stream!
Turns out that the Content Decryption Module is related to the video stream too. A quick Google search and we learn that it “allows Chrome to play DRM-protected HTML5 video and audio”. So, in fact, that basketball game is using most of my CPU resources. If I’m not actively watching it, that’s a good tab to close or pause!
And you can check for memory hogs on your tab list too by simply clicking on “Memory” in the Task Manager window. Here’s what you’ll see:

Other than the content decryption service, doesn’t look like the streaming video service is particularly aggressive in memory usage. You can see how this all fits together to help you decipher what’s going on and identify the tab – or extension! – that’s the culprit with your performance issues.
Pro Tip: While you’re here, please do check out our other MacOS X help articles and tutorials. I’ve been writing about the Mac for a long, long time…