
I’ve been trying to figure out what people mean when they talk about the “market cap” of a company like Google. Can you explain it to me, please, along with any other useful or interesting tidbits about reading financial data for a publicly traded company?
There’s nothing more baffling than the financial data shown for public companies, so I completely understand your befuddlement with market cap figures. Nonetheless, if you imagine that the ownership of a company is split into thousands or millions of shares, then you should be able to see that some simple math concepts give you interesting results.
For example, if you know that a company has 10 million shares outstanding (e.g., issued and available for sale on the market) and that each share is worth $37.50, then the market capitalization, the marketplace’s estimate of the overall net worth of the company, is calculated by multiplying those two figures:
$37.50 * 10 million = $370 million
Not too much rocket science there, I hope. Now, if that stock goes up $1/share you can see where the market cap of the company just bumped up $10 million, at least theoretically, and if the stock goes down a dollar, the company loses $10 million dollars. That’s why seemingly irrelevant changes in stock value (like having it lose $0.03/share in value) are important: they’re multiplied by the total number of outstanding shares and even a drop of three cents in our theoretical example would mean a drop in the valuation of the overall company of $300,000.
Now let’s check out Google (NASDAQ: GOOG). According to the Wall Street Journal, as I write this here are the key financial indicators:
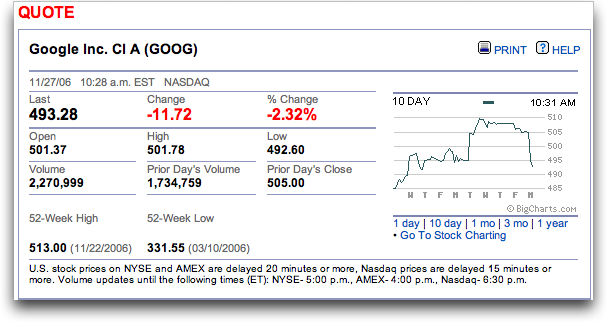
A little further down on the page the market cap for Google is shown: 154,609.30 million dollars, or, normalizing it just a bit, 154.6 billion. That’s a lot of online ad clicks!
You can also work backwards. If we know that the market cap is 154.6 billion and that each share is currently trading at $493.28 then it stands to reason that you can divide and get the total number of shares outstanding in the marketplace:
154,609,000,000 / 493.28 = 313,430,506
So this indicates that there are roughly 313 million shares of Google outstanding. Now you can see that a drop of $11.72/share multiplies out to a loss of 3.67 billion dollars. That’s something to pay attention to, unquestionably, but with Google’s market cap, it’s not a crisis in value.
(By the way, the WSJ also has a very interesting Goog-o-meter that shows you the relative market cap of Google and a dozen other large companies. It’s darn surprising to see that Google’s worth more to the financial marketplace than FedEx, Intel, McDonald’s and AT&T, just to name a few.)
At the end of the day, however, smart companies don’t pay attention to the day-to-day fluctuations in their stock price and market capitalization, because they’re building for the future, they’re executing a smart strategy based on where they think that the market is going, rather than where they think that the market is today.
So market capitalization is an interesting figure, but there are more important indices to be tracking, like price/earnings ratios (“P/E Ratios” on the charts) and the actual quarterly results for any given quarter that the company has been in business. Are things trending favorably for a brighter tomorrow or not?
Hope that helps clarify market cap for you!
thanks fo r this resouseful tutorial.
I saw your explanation on market capitalization. It was informative. Can you please explain what Price per earning ratio means and how significant is it in knowing a company’s performance.
$37.50 * 10 million = $370 million
Don’t you mean $375 million?
“Not too much rocket science there, I hope.” Nope but as they say 7/5 people don’t do the math 🙂