
I feel like I’m running out of memory on my Windows computer. How can I run some sort of performance monitor to find out? I don’t want to install any third party apps, by the way, just something included with Windows 10 if possible.
If you are fearing that somehow your PC is memory constrained, then it probably is. Applications keep getting more and more greedy for disk space and RAM memory so if you’re still running on an older PC, your hardware isn’t keeping up with your software. Certainly my standard advice for anyone buying a new computer, whether they’re going to run Windows, MacOS X or even Linux is to get as much RAM as they can afford. The difference between 8GB and 16GB is quite significant, and if you’re working with video or a hardcore gamer, upping it from 16GB might be worth the cost too.
But how do you tell what’s slowing down your computer? There are three main categories of slowdown other than malware sneakily operating behind the scene: CPU, memory and disk usage. If you have an old hard drive, not one of the newfangled SSD drives, that could significantly slow down a game, for example, that keeps wanting to load big data files. The good news is that you can monitor all three with the built in Performance Monitor in Windows, but it’s a bit clumsy to set up properly.
To start, just search for “performance” in the Windows 10 search box:

Don’t worry, you don’t need to run this as an administrator since it’s just reading performance data. Click and launch “Performance Monitor” to proceed. It opens up a really boring app. Heck, even Microsoft seems to acknowledge that in the opening screen info:

There is some info shown here but the fun is really in the “Performance Monitor” real-time graph. Click on the words “Performance Monitor” on the left side and you’ll see, well, a blank box:
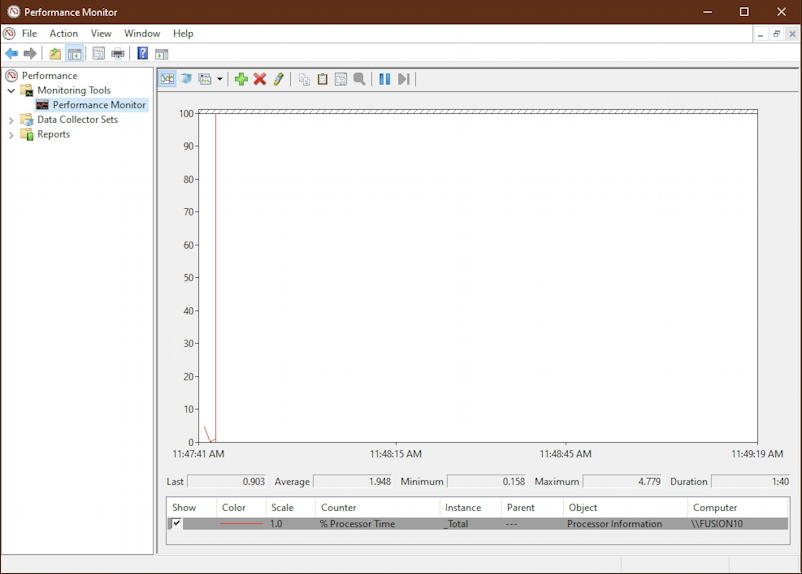
If you watch, the red line along the bottom is actually showing the percentage of processor time being consumed on a per-time-unit basis. If your computer is working hard, the red line will be near the top. If nothing’s happening, it’ll be near the bottom, as mine is.
The real fun with this particular Performance Monitor program is customizing what data you track. And there’s a ridiculously large number of options, hundreds of them if you’re so inclined (or a software engineer). Fortunately, even us laypeople can find value here. Click on the green “+” along the top and you’ll be able to add more data to monitor:

The list of categories is on the top left box, find one that you’re interested in – like “Memory” – and click on the tiny downward “v”. Specific data items appear and you can select and add as many as you want. My recommendation for tracking RAM memory usage is to choose “Available MBytes” under Memory. Select it on the left then make sure you click “Add >>” to move it to the right side. Then click “OK” and it’ll be added to the graph.
Now, with that running, launch a few programs to watch how they impact what’s going on. It can be pretty dramatic, as you can see below:
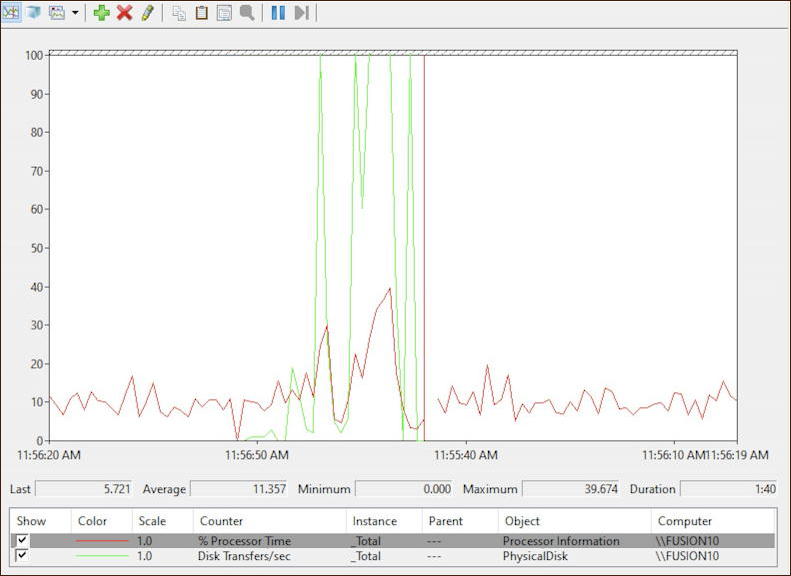
There’s a third variable to track here too, disk usage.
Go back into the monitor settings (the green “+”) and add “Disk Transfers/sec” under “Disk”, as shown:
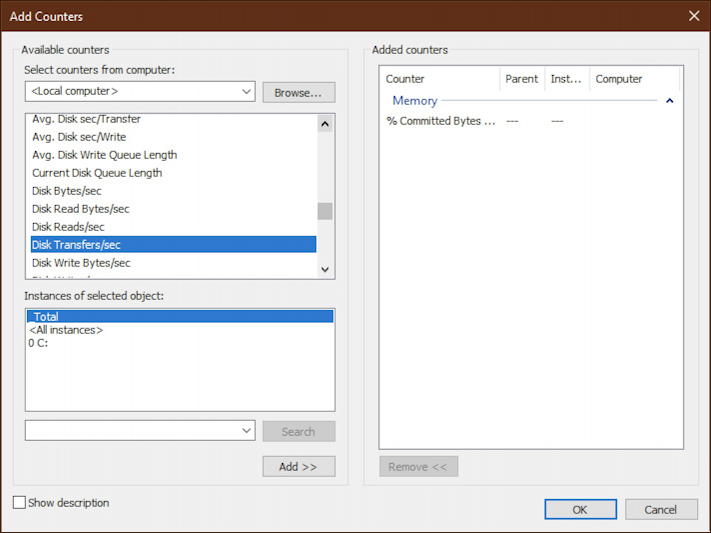
Again, don’t forget to click that “Add >>” button before you close the window!
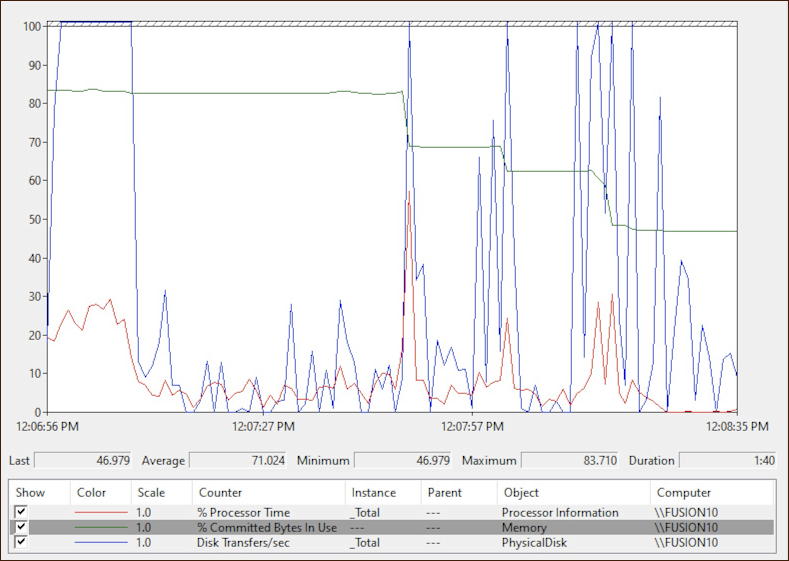
Now launch some programs, let them chug along, then open a few extra tabs in a Web browser. Here’s what I saw on my PC when I did that:
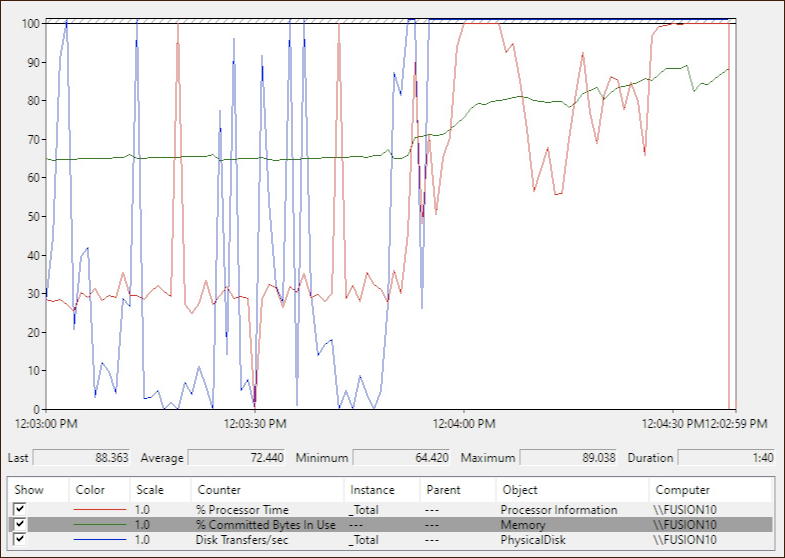
Remember, red is CPU, blue is disk usage and green is memory used. No surprise, as more apps are launched, CPU usage goes up (even maxing out at 100%), disk usage gets slammed (especially when an app is just starting up) and memory used keeps marching upward in steps as each program and app requests its allocation.
Don’t like the color of one of the performance graph lines? Right click and you can inspect the Properties. There’s quite a lot about each datum you can tweak, including its color:

And so, what happens when I start to close those browser tabs and gradually quit the demanding games, apps and programs? Just what you’d expect:
With this information available and plotted in real time, you can now launch and quit different applications to see if your PC has sufficient resources for your usage patterns. If not, then yes, it’s time to update, but it might just be a really greedy app (for example, Google Chrome eats up a lot of memory).
Pro Tip: I’ve been writing about Windows for quite a while. Please check out my Windows 10 Help for lots more helpful tutorials and how-to guides while you’re here. Thanks!
It may be the way my computer is set-up, but I found the grey letterings on a blue background extremely hard to read. But thanks for the information. Very informative.