
I’ve been doing some research on long-term stock pricing trends and need to find data on publicly traded companies. Any clues on where I can find this sort of information back for the last decade or so?
Ordinarily I would answer that there are few places you can find long-term historical data online, but in fact there are a number of interesting places for your research. One of the newest and most interesting the newly revamped Google Finance (Nasdaq: GOOG), which offers historical stock data back forty years.
For example, let’s consider how Hewlett-Packard (Nasdaq: HPQ) has done in that time period. By default, you get a very narrowly focused chart on the relevant financial information page:
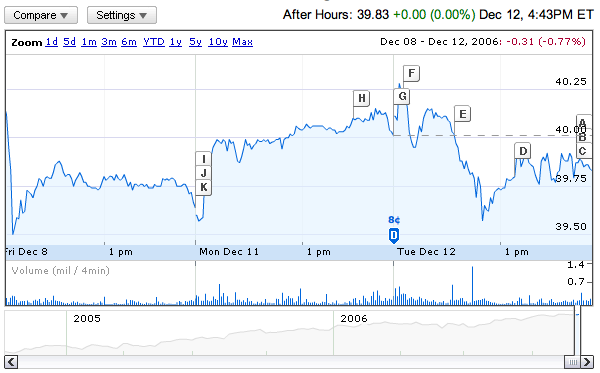
Notice on the top left the different Zoom ranges you can select: 1 day, 5 days, 1 month, 3 months, 6 months, year to date, 1 year, five years, 10 years and “Max”. I’ll click on Max so I can see how the company did for the last 35 years:
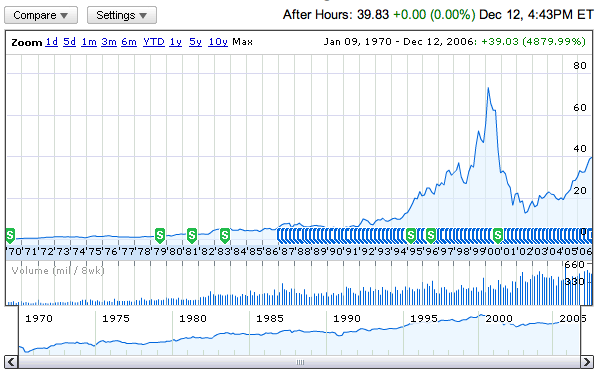
That’s January 9, 1970 through today, December 12th. You can see that the highest stock value was back during the dotcom explosion, at the beginning, around 1999 or so, and since then it’s tanked, then come back about 50%, to close at 39.83 today.
Google isn’t the only place to find this sort of information, however. For many companies, you can actually find this sort of historical information on the “investor relations” area on their site.
In fact, Yahoo Finance offers up an additional five years of historical data:
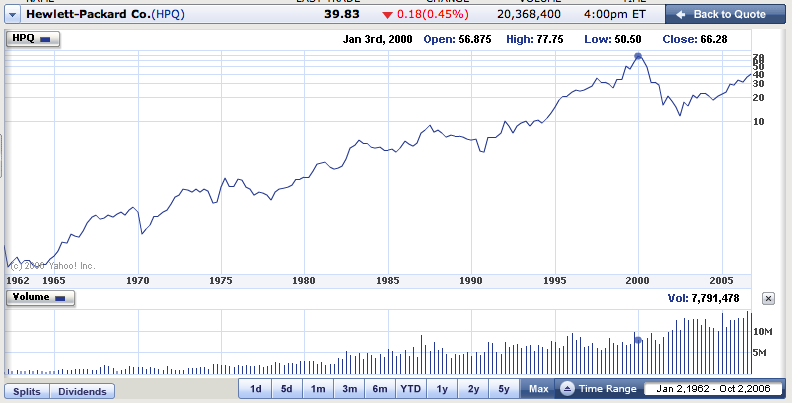
The problem I have with the Yahoo charts is that they use a logarithmic scale, so the difference between $0 and $10 is far, far greater than the difference between $50 and $70 in stock value, which greatly distorts the actual data.
One more stop: I’m a big fan of the Wall Street Journal, and they have a “quotes and research” search option right on the home page. Entering HPQ into that search and I get a tiny 10-day chart and the option of going to their charting area. I’m not surprised that they have a splendid charting feature and data that goes back far far earlier than either Yahoo or Google, back to the beginning of trading for Hewlett-Packard:
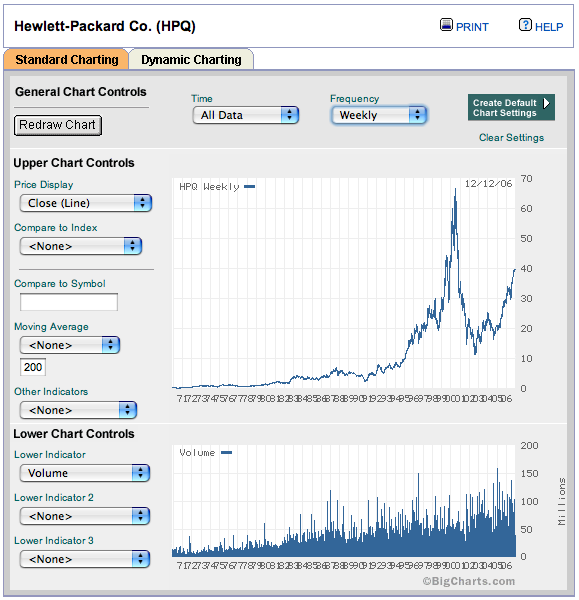
Unfortunately, the WSJ information is only accessible to [paid] subscribers, but you can sign up for two weeks of access perfectly free, which might well be sufficient time to accomplish the research you need. If not, I suggest you check out Google as shown above.
If not, MSN Money has its own charts you can explore too, though HP’s chart only goes back ten years. But since these search engines are all in heated competition, it won’t surprise me if MSN offers 20-40 years or more in the next 90 days.
Hey gang,
Just wanted to let you know that I recently finished a college project around machine learning with stock data. I’ve carved off the data fetching portion and launched it as http://www.free-stock-data.com
You can get historical tick data, as well as basic and advanced current quote/quantitative data. Enjoy!
David,
Thank you very much! I didn’t need a ongoing data subscription so I just purchased a huge dump of US equities data from them for about $500. Included delisted, split adjusted, split unadjusted as well as a symbol dictionary et al. Just what I needed to start some serious research.
Best,
Sean
please some one tell me how one can avail / view the nse’s histrorical intraday co-movement charts with tick of 15 / 30 minutes
Hi Dave. I noticed this posting awhile ago and wanted to mention that I have been compiling historical stock market data for years now. I have a whole assortment of sql databases and flat files. What I noticed over the years was that it was hard to get large amounts of historical data at once. Only a few at at time from various sources. There are some places where you can get 20 years or so of historical data but they give you thousands of individual excel or ascii files. I have the data in sql databases and single, large .csv files. Oh, I am not giving these away. They are for sale. People can contact me at via my website. Thanks
Bob
Hi Gents,
While I agree with you that there are some free charting as well as some historical data which can be downloaded sparingly, I would suggest that to do real trend analysis, modeling and systems development for algorithmic trading strategies, along with associative research and back testing. You need a complete local database of historical data to use with your charting and analysis package of choice. To see the dramatic difference involved between looking up symbol data online and havinga complete database try the free trial offered by these guys…
http://www.forextickdata.com
They have end of day data and intraday high frequency historical data, across multiple asset classes.
They support a very nice integration script for Amibroker Pro.
Happy research.
David
Hi Ciro,
On the Google finance or Yahoo finance sites when looking at a chart there exists on the same page a choice that says,’Historical Data’. Clicking on this will take you to a page that gives you the data in html text format or will even open it in Excel for you allowing you to save it as text.
Cheers,
Darrin
Ciro here: Sorry I did not mention it is historical optionable stocks going back six months, preferrably one year I’m looking for. Ciro
Dave: I’m an individual options trader doing and writing my own computer programs for evaluation of profitable options candidates. I’m looking for optionable stocks in all markets in the form of a simple ASCII line sequential format that would only include TICKER SYMBOL, CLOSE PRICE and DATE sepatated by commas. No charts or inbedded indicators, just simple data.
I’ve come across a source that provides this kind of service free, but it’s only for the S&P 500. Is there a source (preferraly free) that would include all markets. This is something I would need on an infrequent random basis. Thank, Ciro
I like google’s improvements but I would ask the same quetion for Mutual Funds- Google has not kept up on mutual fund performance. Look at JAGIX for example. Yahoo seems to have the best historical data for Mutual Funds, including dividends. But absent any tool I can find are capital gains distributions.
All those sources Dave mentioned are excellent, but the thing that caught my attention was the research part of the question. In doing research on stock market data, usually you are trying to identify trends and/or cycles.
I operate a site about stock options at http://www.volatilitytrading.net where I post something called swing charts. These are based on an algorithm developed by William Dunnigan and published in his book “One-Way Formula for Trading in Stocks and Commodities.” What is interesting above this is the technique was developed in the early sixties. Even now in our more volatile markets, the technique does an excellent job of identifying market swing points and thus trend. I guess you could say he captured a fundamental characteristic of publicly traded markets.
Before you go looking for his book, let me say be prepared to pay. The last time I found a copy it was priced at $250.00 and that was two years ago.
Hi Dave,
Thanks for commenting on my blog!