
My Mac system used to be pretty snappy but everything seems to have slowed way down. It’s frustrating! How can I identify what program or programs might be the culprit? I just want a fast computer again.
Whether you’re on a Mac, a PC, or even an Android tablet, there are some programs that demand more resources than others. Word search? Easy. 3D animation rendering? Hard. But how do you figure out what’s eating up all your resources and slowing you down? That’s a bit more complicated. The first thing to check is disk space, actually; if you have less than about 10% free disk space, that by itself could significantly slow down your Mac system. The next common problem is a lack of RAM. If you have too little memory almost any program can slow things down quite a bit.
But let’s be honest, most likely the culprit is a program or utility that is inefficient in its use of resources or just really puts a big demand on your system. Though Mac users seem a bit less susceptible to adding little extensions and add-ons to their system than their PC brethren, it’s a good idea to also check your own Mac to ensure you haven’t added anything that you don’t really need. Fancy cursors? A desktop photo that changes every few seconds? Streaming network backup services that are always on, always scanning? Those can all be problematic.
ASSESS YOUR DISK SPACE STATUS
Start with a quick check of your disk space utilization. Easily done with Disk Utility, which you can find in Applications > Utilities. Make sure you have chosen your main drive and you’ll get a nice graphical representation of space utilization:
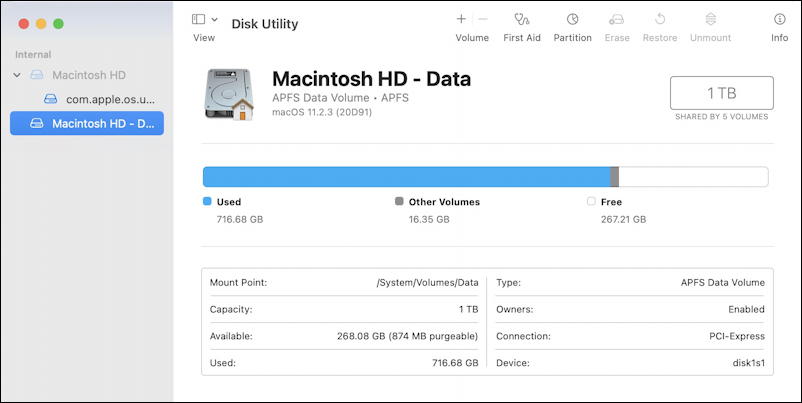
On my 1TB drive, about 267GB is free so I’m using about 74% in total. Plenty of free space. If your drive is filling up, then you need to do some maintenance to clean things up and free up space. Here’s a tutorial that will help you get started: What’s Eating Up All My Mac Disk Space?
MEASURE MAC PERFORMANCE WITH ACTIVITY MONITOR
The best tool for understanding what’s going on with your MacOS system, however, isn’t Disk Utility, it’s Activity Monitor. Also found in Applications > Utilities, it’s a great program for gaining insight into what’s happening on your Mac, whether you have an older iMac or a brand-new M1 MacBook Pro. Launch it, however, and the values are all zeroes: Activity Monitor does a second-by-second analysis, so it needs a few seconds to get started. Once it’s running, you will see something like this:
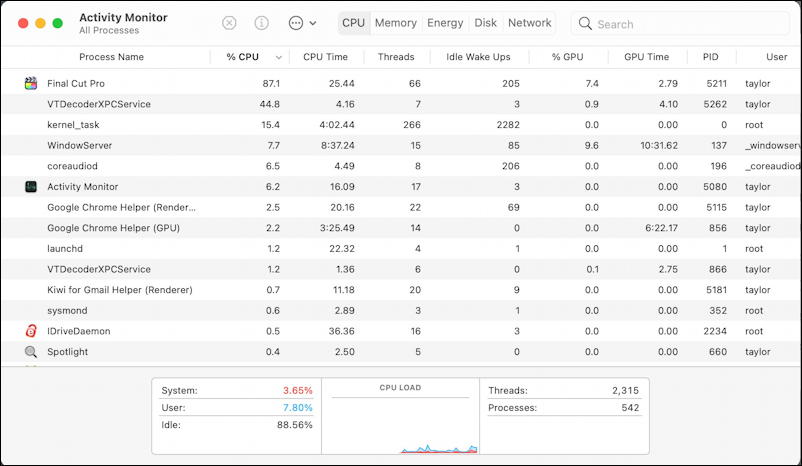
Notice along the top that there are five tabs: CPU, Memory, Energy, Disk, and Network. There’s also an ‘x’, an ‘i’ and a ‘•••’ button, but we’ll get back to those. To understand how this works, look at the column heads in the data table. Think about this all as a live spreadsheet, by the way, and it’ll make a bit more sense.
Key idea: You can sort based on any column of data by clicking on that column title. Click a second time and it’ll reverse the sort order. And so on…
In the above image, I have clicked on “% CPU” to have the processes using the most processor resources to jump up to the top. As shown, the top dozen or so processes (programs) really take up the vast majority of the processor and, of course, it can add up to a lot more than 100% because it measures per-core and if you have a quad-core processor, that’s essentially the possibility of 400% CPU. Octa-core gives you 800% of CPU resources, and so on.
Needless to say, Final Cut Pro, a video editing program, is eating a lot of my CPU, along with its companion system tool VTDecoderXPCService. Focus your attention on those processes that include a tiny icon image as those are user apps: Most of what you see on the list are system processes (including anything with XPC in its name).
Also look at the bottom of the window where a small graph is shown. A glance reveals that the overall CPU load is pretty low, and as you sit and watch, the graph will continue to show new data, so jumping back to the program you’re suspicious about and using it for a bit will help produce meaningful data.
RAM AND MEMORY USAGE ON MACOS 11
Click on the “RAM” tab and you can check the next area that might be problematic: Memory utilization.
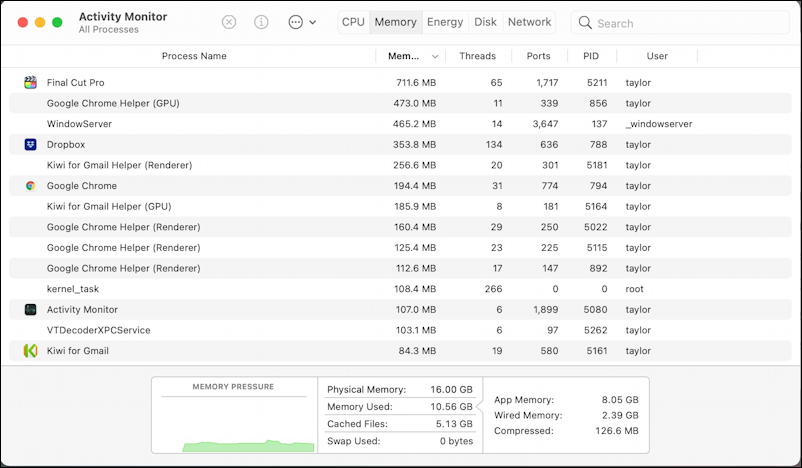
A quick glance at the graph at the bottom of the page reveals that there are no big issues and the currently available memory – 16GB of “physical” memory – is working just fine. You can also check battery and energy consumption too, particularly helpful if you find your battery life stinks…
ENERGY AND BATTERY CONSUMPTION BY MAC APP
I have to admit, I use a lot of high demand programs on my own MacBook Pro and am used to my battery life being somewhat mediocre. But why? What programs are actually consuming the most power? That’s another area where Activity Monitor can be helpful: Just click on “Energy”…

There’s a program that’s crushing my battery, but let’s start with a quick glance at the graph on the bottom. Notice that I haven’t used my computer for a few hours, so the “Battery (last 12 hours)” shows a straight line, and then it starts plummeting. Yup. Use your computer, it requires more power than if it’s closed and sleeping 🙂
What program’s the culprit? The column title “Energy Impact” (shown above as “Energy Imp…”) reveals the truth: Final Cut Pro is eating an alarming 95.9% of my total available system power. Makes sense, though, since video rendering is one of the toughest and most CPU demanding processes you can run on a computer.
Otherwise, things are looking good, with Activity Monitor itself using 8.8% and Google Chrome requiring a mere 1.7% of energy. Extend your battery by avoiding the worst offenders if you aren’t plugged into a power source. Easy enough.
WORKING WITH INDIVIDUAL PROCESSES IN ACTIVITY MONITOR
You can also explore areas of Activity Monitor like Disk and Network, but let’s wrap up by having a look at what you can do to learn more about a specific process. That’s where the “x” and “i” buttons become important. Click on a specific process on any of these views, then click on “i” to get information about the process:
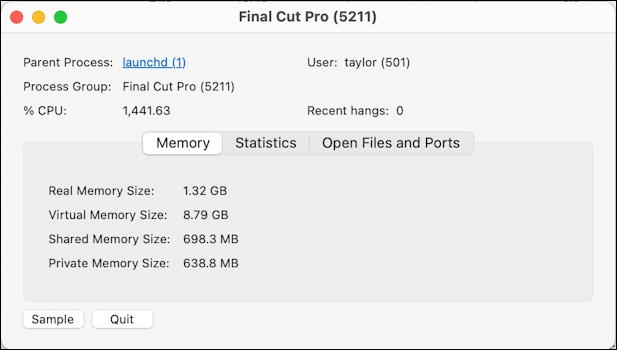
Notice that the process is being massively greedy on CPU, utilizing 1,441.63% of my system CPU. Yikes! That’s enough that it will noticeably slow down any other program running on the computer.
With that in mind, you can actually quit or force quit an application within Activity Monitor (if you have correct permissions, of course). With Final Cut Pro selected, for example, a click on the “x” pops up this window:

I urge you to think carefully about quitting an app from within Activity Monitor rather than just switching manually to the program and quitting. Most programs close more gracefully and cleanly when you quit them directly. Failing that, choose “Quit” and give the program a few seconds to process the request. If that won’t work and the program refuses to quit, then you can use “Force Quit” but be aware it is like an ax falling; a very aggressive way to end a running program that doesn’t give it a chance to remove temp files, close open files, etc.
These various aspects of Activity Monitor plus Disk Utility should help you get a much better handle on what’s going on with your own Mac and why it’s slowing down. Good luck!
Pro Tip: I’ve been writing about the Mac since the early days, and have an extensive Mac help area here on the site. I invite you to check it out while you’re visiting! Thanks.