
My baby is particularly sensitive to air pollution of all kinds and as a result, we have learned we need to check smog levels before we go out. What’s the easiest way to check air quality, and what about for locations other than our home? Thanks, Dave.
While it may be a bit of a surprise, overall air quality in the United States has improved quite a bit in the last fifty years or so. The key change was the Clean Air Act, passed in 1977, that regulated factory and vehicle emissions. Of course, fifty years ago the USA had a population of 211 million versus today’s 336 million. That’s a huge jump in a short time, and it’s no surprise that the millions of additional cars and homes, along with greater infrastructure, have all added to our air quality actually beginning to decrease again, an alarming trend.
Back in the pre-Internet days, we’d learn about bad air quality days through radio warnings of “Smog Alerts” and if it wasn’t bad enough for that – like a day with bad smoke from a fire – we’d just go out and hope for the best. Not optimal. Nowadays, as with so much else, we have a glut of information on air quality and from smartphones to Web searches to desktop apps, and even voice-controlled systems like Alexa, it’s surprisingly easy to get the data you seek.
Shortcuts: Google | Accuweather | PlumeLabs | AirNow.Gov | Mac Weather | Windows Weather
Start out by saying “Alexa, what’s today’s air quality?” My device responds by informing me that “according to air now dot gov, the air quality is 43.” Easy enough. But what does ’43 mean and is that a great figure, a mediocre one, or something quite concerning? To find out, let’s go online…
GOOGLE FOR THE AIR QUALITY
The easiest is to simply do a Google search for “air quality”. You can let it use your current location or easily specify a location like “Los Angeles”. When I search for Los Angeles air quality here’s what it reveals for 14 April, 2023:
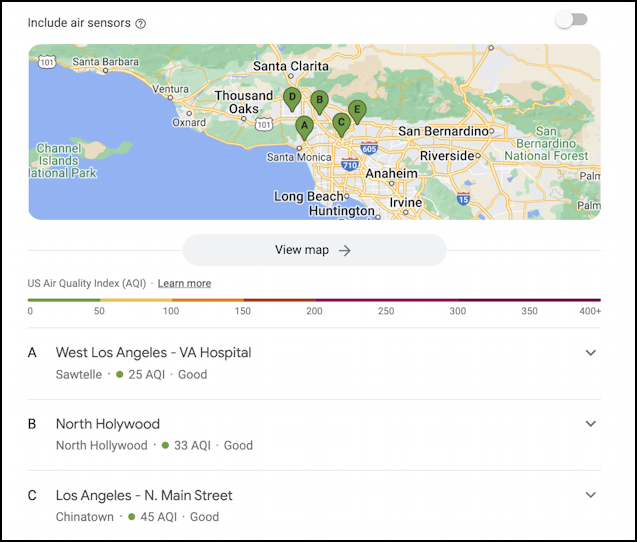
You can see that there are five sensors it’s reporting and that the air quality differs quite a bit from location to location. In West LA, the VA Hospital reports an AQI (air quality index) of 25, while Chinatown in central LA, a city known for some of the worst air pollution in the entire LA Basin, reports 45. That’s almost 2x Sawtelle (West LA), and pretty close to the yellow zone as shown on the gauge in the middle. Anything over 50 is probably cause to reconsider outdoor exertion if you’re sensitive, and over 100? Not great. If AQI reaches 150 or higher, it might be a good day for indoor activities, especially for your baby.
ACCUWEATHER OFFERS EXCELLENT AIR QUALITY INFO
While you’re in your Web browser, hop over to Accuweather and you’ll find its air quality information is excellent. A search in Accuweather for Los Angeles reveals this higher level of detail:
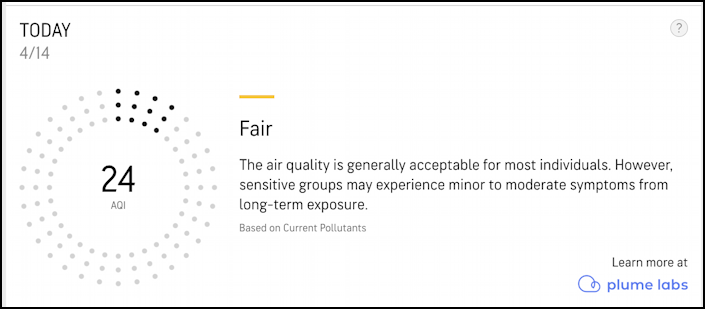
Herein begins the challenge of understanding AQI: Why is Accuweather so different from the Google results, and why does it show AQI 24 as “Fair” when Google’s results even have an AQI of 45 as “Good”? It turns out that particularly in large urban regions like the Los Angeles area it makes a dramatic difference where the sensor is located. Accuweather is utilizing Plume Labs for its air quality analysis but doesn’t reveal where those are located. Imagine, for example, that they are along the coastal area of the city, where a fresh Pacific Ocean breeze might well lower the reading.
Accuweather also breaks down the AQI into individual particulate matter readings, which can be quite interesting:
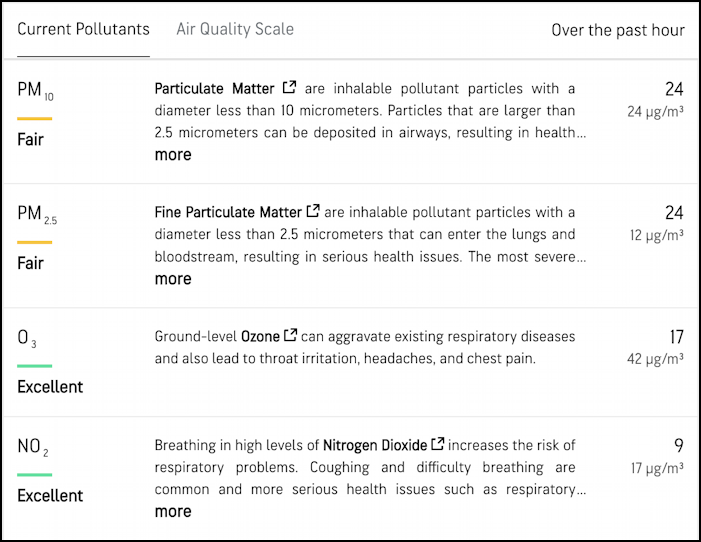
Here you can see that different types of air pollution have different readings; Ozone levels are rated as “excellent” with a value of 17, while particulate matter and fine particulate matter in the air are more problematic, being rated as “Fair” with a reading of 24. For most people, it’s the particulate matter that’s concerning because it can build up in the respiratory system, though all of these are a matter of concern if you seek to be as healthy as possible!
There’s a lot more information you can unearth about all of these figures that combine to produce an air quality index. It’s what the Internet was made for, honestly, so be prepared to fall down an informational rabbit hole once you start searching for “how is AQI measured”, “how much fine particulate matter in the air is safe for babies” and similar.
Accuweather utilizes PlumeLabs, which has its own Web interface too…
PLUMELABS AIR QUALITY ANALYSIS
Popular sites like MSN, Google, and Bing actually utilize other services for their AQI readings, as does Apple Weather, Accuweather, etc. One of the most trusted is PlumeLabs, and its site offers yet more insight into the LA air situation:

What I like about this is you can see how it varies by day and time of day. No surprise, it’s worse during the week when people are all driving about to work, often with painfully long and slow commutes. Wait until 1am and it’s better than the early afternoon (no surprise to Angelenos). You can also see yet another figure for the LA AQI: 26. How is that different from what it’s reporting to Accuweather? It’s a mystery.
AIRNOW REPORTS OFFICIAL GOVERNMENT DATA
Remember how Alexa referenced “AirNow”? Turns out that’s the Environmental Protection Agency’s official reporting site for air quality sensors and can be checked by regular citizens too, not just scientists. Go to AirNow.Gov and you’ll find it has its own reporting system:

You can dig in further, but what it’s showing is yesterday’s AQI, today’s AQI (notice Central LA is at 55!) and tomorrow’s air quality forecast (which isn’t available for the three reporting locations shown in the above image, interestingly). Glance along the top bar and you’ll see it can help identify why there’s bad air quality too, including with its information about fires across the United States.
APPLE WEATHER AIR QUALITY INDEX
Mac systems have a slick weather app included with MacOS that offers air quality info and allows you to search for any city in the world too:
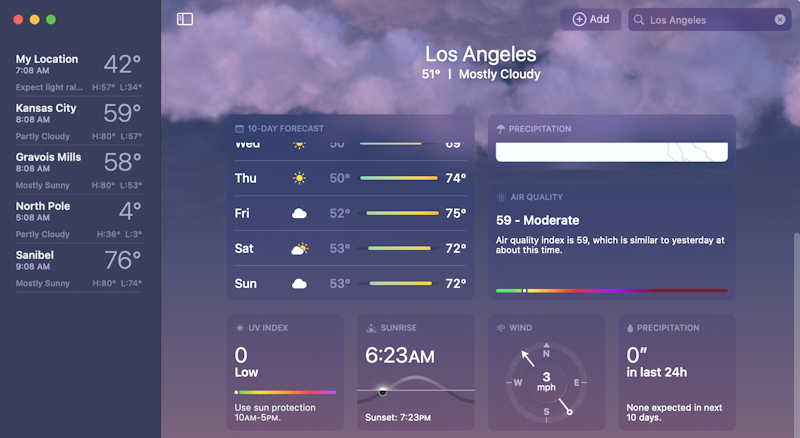
The display is far more visually attractive, but now we’re seeing an AQI of 59 and a rating of “Moderate”. Do any of these darn readings agree with each other??
Oh, and mobile devices can show air quality too, as this display from the iPhone’s weather app demonstrates (for Kansas City, MO, just to mix things up a bit):
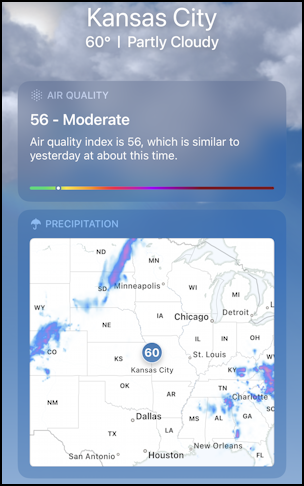
It’s very similar to the Mac app, which is a nice bit of consistency and the tiny bar with the dot showing current AQI is a quick way to see if things are pretty good or trending to something dangerous. If it’s further along than about 20% then you’ll want to be careful, for sure. Here’s how that might look, the AQI on a hot Autumn afternoon in New Delhi, India:
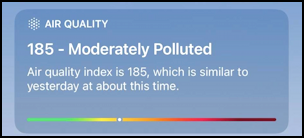
Definitely the kind of weather to justify skipping your outdoor run or even a stroll in the park.
MSN WEATHER ON THE PC
Not to leave Windows users out, MSN Weather (the default weather app on Windows) offers air quality information too, though without much in the way of details:
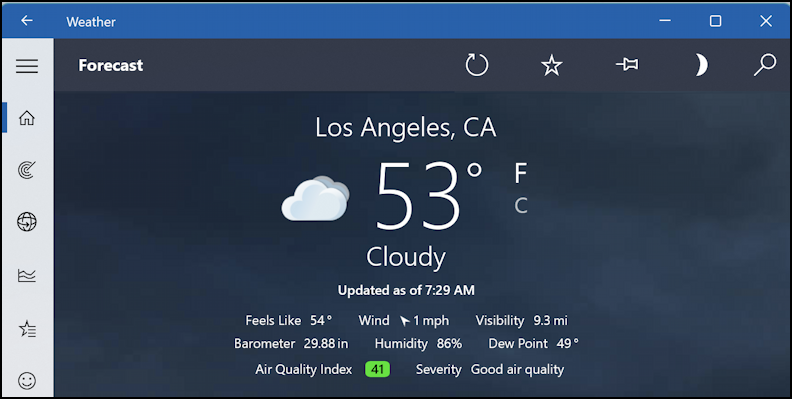
Can you see the information along the bottom? This reports an AQI of 41, rating it “Good air quality”. This means that we’ve considered quite a few different AQI reporting tools and none of them agree on the actual air quality. The obvious conclusion is that you should take it as a “rough” number and assume it has a 10-20% error rate. At the simplest, if it’s reporting an AQI of over 50 you’ll want to consider limiting your outdoor time with the baby, if it’s over 75 then maybe focus on going from indoor space to indoor space, and if it’s over 100, you might just spend the day at home with the baby.
One more point is that there are lots of air purifiers and air filters available for home and office use that can significantly lower particulate matter and volatile organic compounds (VOCs) which can be your personal defense against bad air quality. I’ve reviewed a lot of them on my AskDaveTaylor YouTube channel if you want to learn more about them.
Pro User Tip: I’ve been writing about computer and Internet basics for many years. Please check out my computer and Internet basics help area for lots more useful tutorials on AI and much, much more!