
If you’re a content producer, you should already be creating and posting videos on YouTube. With millions of searches every hour, and billions of videos viewed weekly, it’s another important place to attain visibility for your company, products and services.
But how do you know whether people like your videos? Sure, there’s the view counter and there’s a like/dislike indicator, but those are crude and almost pointless because someone who watches four seconds of your video and bails is counted identically to the next viewer who watches the video all the way through and visits your Web site immediately thereafter.
Turns out that the team at YouTube know this and have some pretty interesting analytics built into the video hosting service that offer a lot more insight. Let’s have a look…
Needless to say, if you don’t have any videos online yet, this isn’t going to be very helpful because you cannot access the analytics for other people’s videos (interesting though they might prove to be!).
Still, it’s surprisingly easy to create a 2-3 minute screen capture movie or even pull together a video based on the video recording capabilities of most smartphones. Heck, you can even have a photo montage with a voice over that can be effective.
And as with any analytic data, remember to keep in mind that it’s not sheer numbers that we’re after here, but the right people finding your product or service at the right time. For some videos 75 views is terrific. Don’t be discouraged that you aren’t hitting millions of views, in other words! 🙂
Right. On to YouTube. Easiest way to proceed is to go to your own channel on YouTube. My channel is http://youtube.com/askdavetaylor, and here’s a typical video in the listing:

You can see here it’s 2:20 long and has garnered 423 views in the month it’s been online. Not too bad for a speaker review I recorded in my basement. 🙂
Click on the video to get to its page and here’s what you’ll see:
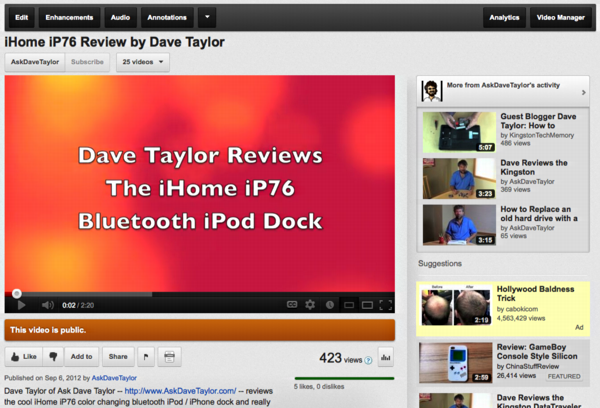
What you seek is on the top right of the page, “Analytics”. Here, if we look a bit more closely at the black toolbar you’ll see what I mean:

Click on “Analytics” and there’s a world of information available to peruse. The most basic elements shown are views, minutes watched in aggregate (though I can’t figure out why that’s at all interesting) and money earned through Google AdSense on that particular video:

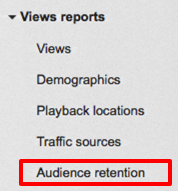
The most interesting analytic to me, however, is the graph of where along the video most people give up and bail. That’s available too, for every video you put up on YouTube. You just have to look on the left side in this area of the site for the link “Audience retention”:
Click on it and you’ll now see a graph that shows viewers vs time in the video:

I think this is pretty darn interesting, because it shows you that people don’t watch all the way through and that – in this case, at least – the drop-off is fairly uniform. The only perturbation in the line is at about 0:34, at which point there’s something sufficiently interesting in the video that everyone stops bailing for ten seconds or so and stick with the video instead. Useful: figure out what’s at that point and make sure you do more of it in subsequent videos!
If there was a point where the drop-off increased, you could again go back and study that portion of your video and ascertain what’s turning people off. Is it when you say “now let me tell you how much it’ll cost!” perhaps? Or “Let’s go back and look again” or something else that’s a signal that it’s okay to split?
As with all analytics, there’s interesting information to be gleaned, but only if you actually take the time to dig into it and understand what it’s showing.